Forex Broker Unit Economics: Model CAC, LTV, Payback
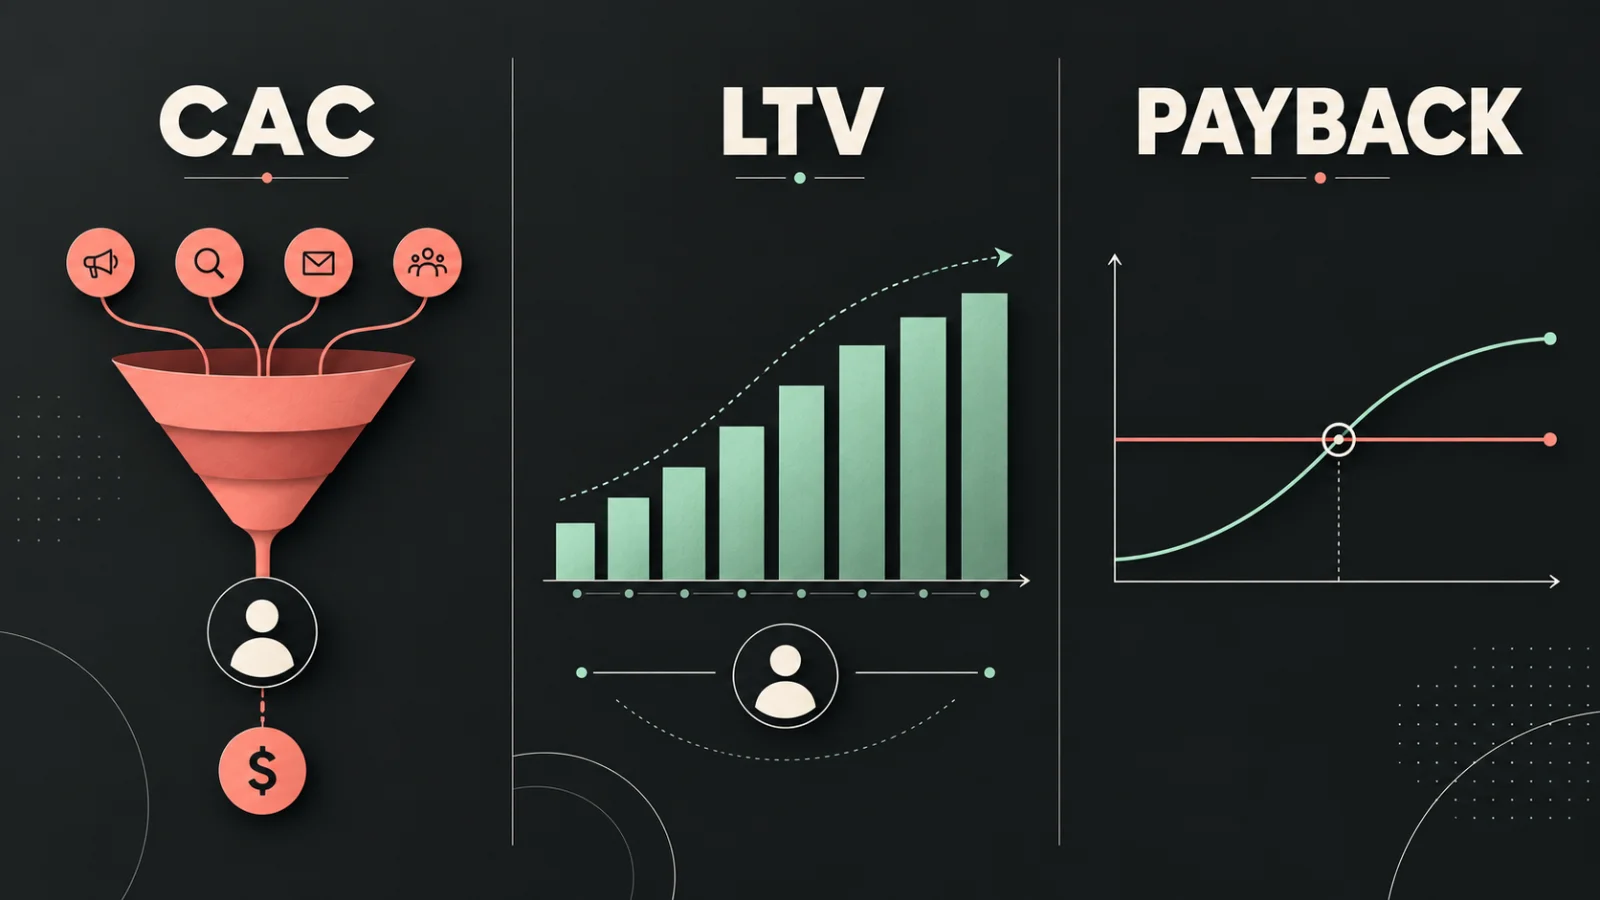
Unit economics is the math that tells you whether a single client makes your brokerage money once every cost of getting and keeping them is counted. For a forex broker, that comes down to three numbers working together: what it costs to acquire one funded client (CAC), what that client is worth over their trading life (LTV), and how long it takes to earn that acquisition cost back (payback period). Get this right and you know exactly which channels to fund. Get it wrong and you can look profitable on a dashboard while actually losing money on every new client you bring in.
This isn't a theoretical exercise. In 2026, with paid advertising for leveraged trading products still tightly restricted by Google, Meta, and Apple across most regulated markets, and with IB and affiliate networks now responsible for the majority of funded accounts at most retail brokers, unit economics has become the difference between a brokerage that scales and one that quietly bleeds cash while its marketing dashboard looks fine.
The quick answer
CAC is your fully loaded cost to acquire one funded account, calculated by dividing total acquisition spend by the number of funded clients, never by leads or registrations.
LTV is the net revenue one client generates over their entire active life with you, built from spread markup, commission, swap income, and B-book P&L where relevant.
Payback period is how many months it takes a client's revenue to cover the cost of acquiring them. This single number tells you more about channel health than a blended LTV to CAC ratio ever will.
A commonly cited healthy benchmark across partner driven businesses, forex included, is an LTV to CAC ratio of roughly 3 to 1, though the number that should actually worry or reassure you is payback period, not the ratio on its own.
Why unit economics matter more in 2026 than they used to?
A few years ago, a broker could throw money at paid social and Google Ads, accept a rough CAC, and still make the math work because client lifetime values were higher and ad costs were lower. That's changed. ESMA, the FCA, and CySEC have all tightened rules on leverage and promotional bonuses for retail CFD and forex products, which cuts into both the size of positions clients can hold and the bonus incentives brokers used to lean on to convert leads. At the same time, the major ad platforms have become stricter about who can advertise leveraged products at all.
The result is that CAC through cold paid channels has climbed steadily, while the IB and affiliate channel, where you only pay a partner once they deliver an actual funded, trading client, has become the default growth engine for most brokers rather than a secondary option. That shift changes how you should model unit economics, because a partner-sourced client and a paid-media client behave completely differently in your P&L, even if they trade identically once they're funded.
I've reviewed a fair number of broker growth decks, and the mistake I see most often isn't a bad channel. It's a broker that never separates CAC by channel in the first place. They look at one blended number, decide it's fine, and never notice that their paid channel has been quietly underwater for two quarters while their IB network was carrying the whole business.
Step one: calculate CAC correctly
CAC is total acquisition spend for a period divided by the number of funded accounts opened in that period, not by leads, not by registrations, and not by demo accounts. This sounds obvious, but it's the single most common modeling mistake in this industry. A campaign that produces thousands of cheap leads and a handful of funded clients looks great on a cost per lead report and terrible on a cost per funded account report, and only the second number matters.
The numerator has to be fully loaded too. That means media spend, the marketing team's salaries, agency fees, creative production, and any deposit bonus or welcome incentive you're paying to convert that client, all divided by the funded accounts that spend actually produced. A CAC figure that only counts ad spend understates your real cost, often significantly.
Industry-quoted ranges for cost per funded account in 2026 vary enormously by region and channel. Cold paid acquisition in a premium market like the UAE or Western Europe commonly runs from several hundred dollars up into four figures per funded client, while high-volume, price-sensitive markets in parts of South Asia and Africa can see cost per funded account in the low hundreds. Treat any number you read, including these, as a directional range rather than a fixed price, because your own CAC depends heavily on your specific market, licence, and offer.
Step two: calculate LTV properly
LTV is the total net revenue one client generates from the day they fund their account to the day they stop trading with you. For a forex broker, that revenue comes from up to four places: the markup you add over the raw spread from your liquidity provider, any explicit per lot commission on raw spread accounts, the margin you keep on overnight swap or financing charges, and, if you run any B-book exposure, the net result of the positions you internalise rather than hedge.
Here's a simplified way to build it. Say a client trades 6 standard lots a month, and your blended revenue across spread markup, commission, and swap works out to roughly $10 per lot. That's $60 a month in gross trading revenue from that one client. If that client stays active for an average of 9 months before churning, their lifetime trading revenue is roughly $540. Subtract a modest per client servicing cost, payment processing fees, KYC checks, CRM overhead, say $2 a month, and you're left with an LTV of around $522 before acquisition cost is even considered.
That 9 month figure matters more than it looks. Retail trading client lifespans vary a lot by broker and market, and anyone telling you a single universal number is being imprecise. Pull your own churn data by cohort before you plug a lifespan assumption into this model, because it's the single most sensitive input in the whole calculation.
Step three: payback period, the number that actually matters
Payback period is how many months of a client's revenue it takes to recoup what you spent acquiring them, and it tells you far more about the health of a channel than a blended LTV to CAC ratio does. Two channels can show the same ratio on paper while behaving completely differently in cash flow terms, and payback period is what exposes that difference.
Take the example above. If you acquired that client through paid media at a CAC of $380, and they generate $60 a month in gross revenue, payback happens around month 6 (380 divided by 60, roughly 6.3 months). Since we assumed a 9 month average lifespan, that leaves roughly 3 months of genuine profit before the client's expected churn point. That's a real business, but it's a tight one, and any softening in either ad costs or client lifespan pushes this from marginal into unprofitable.
Now compare an IB sourced version of the same client. Instead of paying $380 upfront, you pay the introducing broker $2.50 per lot as commission. On 6 lots a month, that's $15 a month, leaving you $45 in net revenue from month one, with no upfront cash at risk and no waiting period at all. There's no traditional "payback period" here because the cost only ever shows up alongside the revenue that funds it. Run the numbers over the same 9 month lifespan and the IB sourced client nets you roughly $387 against a total commission cost of about $135, an effective ratio close to 4 to 1, well above the 3 to 1 benchmark, while the paid client's ratio (522 divided by 380) sits closer to 1.4 to 1, well below it.
Illustrative comparison, not a universal benchmark, replace with your own numbers
Paid acquisition
Upfront cost: $380, paid before you know if the client will even fund or stick around
Ongoing cost: None beyond the initial spend
Payback period: About 6 months, meaning it takes half a year of that client's trading activity just to break even
Net value over 9 months: About $142, which is real profit, but a thin margin for the risk carried
Effective LTV to cost ratio: About 1.4 to 1, well below the 3 to 1 benchmark considered healthy
IB sourced
Upfront cost: $0, nothing paid until the client actually trades
Ongoing cost: $2.50 per lot, so the cost only ever shows up alongside revenue
Payback period: Immediate, there's no waiting period because the cost is contingent on activity rather than paid upfront
Net value over 9 months: About $387, more than double the paid channel's return
Effective LTV to cost ratio: About 3.9 to 1, comfortably above the healthy benchmark
This is exactly why so many brokers have shifted their growth budget toward IB and affiliate networks in 2026. It isn't just that partner acquisition is cheaper on average. It's that the cost structure itself carries less risk, because you only ever pay for revenue that has already arrived.
A quick note on prop firms
If you're running a proprietary trading firm rather than a traditional retail broker, this model needs one adjustment. A prop firm's revenue doesn't come from spread or commission on live trading, it comes from challenge fees, and a meaningful share of buyers reset or retry a failed challenge rather than paying once and disappearing. Your LTV calculation has to include the probability weighted value of those resets, and your cost side has to account for the funded payout liability you carry on the traders who actually pass and start earning a profit split. Modeling CAC against a single challenge fee alone will make every acquisition channel look far less affordable than it actually is.
Frequently asked questions
What is a healthy CAC for a forex broker?
There's no single healthy number, because it depends entirely on your market and channel. What matters more is whether your CAC is comfortably recovered within the client's expected lifespan and whether your LTV to CAC ratio sits near or above 3 to 1 for that specific channel.
How do I calculate LTV for a forex client?
Multiply average monthly trading revenue per client (spread markup plus commission plus swap, and B-book P&L if applicable) by their average active lifespan in months, then subtract ongoing servicing costs. Build this per channel, not as one company wide average.
Why does payback period matter more than the LTV to CAC ratio?
Because two channels can show an identical ratio while one recovers its cost in month one and the other in month eight. A long payback period means more of the client's lifespan has to actually happen for you to profit, which is a real risk if lifespans shorten or market conditions change.
Is IB and affiliate acquisition always better than paid advertising?
Not always, but it's structurally lower risk, because you only pay when a funded, active client shows up. Paid acquisition can still work well when you have a proven, high converting funnel and a client base with a genuinely long lifespan, but it demands more rigorous tracking to avoid quietly funding an unprofitable channel.
How often should a broker recalculate its unit economics?
Monthly, at minimum, and broken down by channel and by partner. CAC, average deposit, lot volume, and client lifespan all shift with market conditions, and a unit economics model built on last year's assumptions can quietly go stale.
Disclaimer: This article is for general educational and informational purposes only and does not constitute financial, investment, legal, tax, or business advice. The figures and worked examples used here are simplified illustrations built to explain the mechanics of CAC, LTV, and payback period, not verified industry benchmarks, and actual results vary significantly by market, regulatory jurisdiction, licence, and broker model. Consult a licensed financial, legal, or compliance professional before making decisions about your brokerage's acquisition strategy, partner commission structures, or regulatory obligations.


Talk to our experts.
Let our experts guide you through every step of the process.